19Feb
Hi, Josh, Trust this mail finds you well. Please, read through the below lines and let me know if you fully understand the task.
Thanks!
COMPANY'S BACKGROUND:
Keystone kitchen wares Ltd is a global firm that specializes on selling all kinds kitchen wares, and they have several branches across four divisions namely: east, west, north and south.
STATEMENT OF PROBLEM:
However, the company has been finding it difficult to have a net profit even from all the four divisions. The Managing Director suspects that the reason for this is because of the huge amount of salary that is being paid to workers is the reason for the current financial dilemma which the company is facing. And his next action is to layoff workers, as he feels that could only be the reason for the company's recent financial crisis.
TASK:
As the HR of this company, I believe that there is more to this. And I wouldn't want my Managing Director to make action based on feelings.
So, as a Data analyst, can you please help analyze the issue on ground in our company? While I provide you with the sets of data needed to do your analysis. I believe this would help inform him in his decision making.
Click here to download the dataset needed.
SOLUTION
STEP 1:
Having downloaded the dataset (also embedded below is the dataset for a quick view), I loaded the dataset to the Power query platform so as to explore the dataset, check for validity, avoid duplicates, and ensure that the datatypes for each field is appropriate. With that done, i then loaded the dataset to Power BI for analysis, visualization, to gain insights and to offer recommendations.
STEP 2:
Now on the Power BI platform, I used the SUMX, DISTINCTCOUNT, SUM DAX Expressions to get certain measures which are paramount to the analysis.
STEP 3:
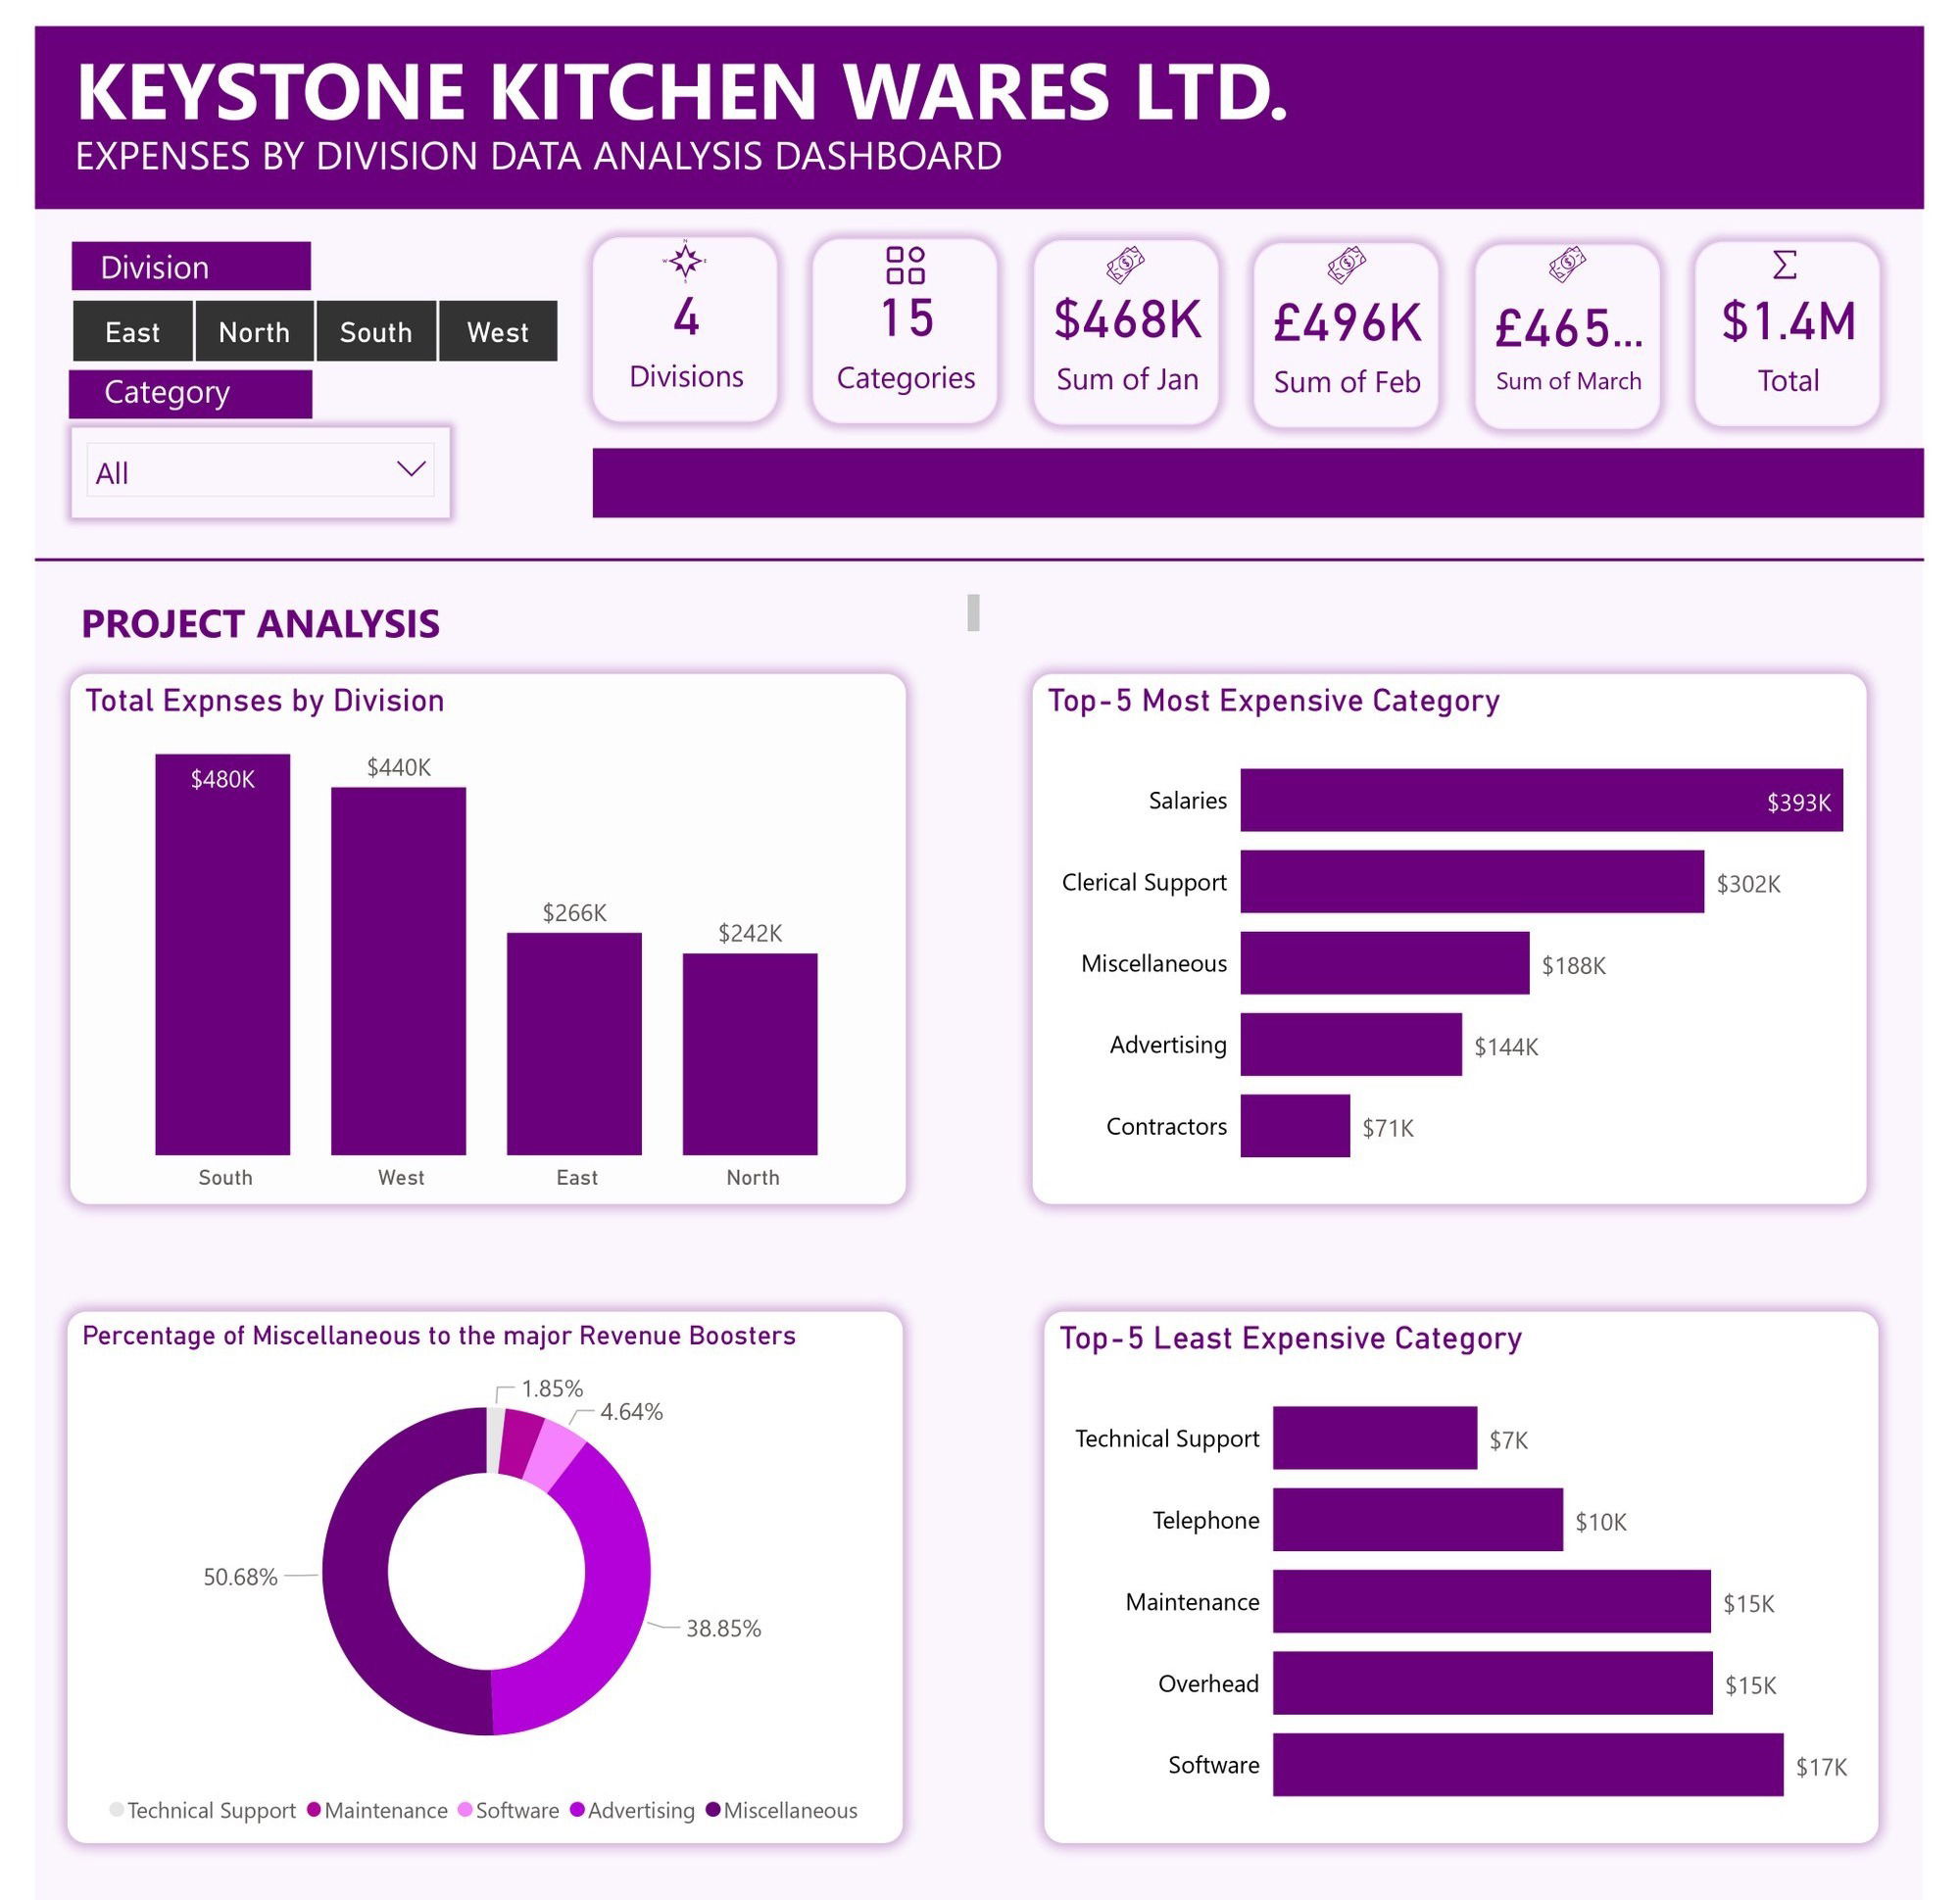
I was able to use four visualizations (Column chart, two row charts, and one doughnut chart) to diagnose exactly why the company is in a financial mess. They revealed things hidden from the eye, and yes, salary payment was not part of the problem. There are order causatives other than salary. When the revenue generation of a company is poor, no matter how low employees are being paid, there will still be financial situations as Keystone Kitchen-ware is currently experiencing.
Click here to view the pdf format of the dashboard of the analysis, visualization, insights, and recommendations. Also attached is the dashboard of the analysis and visualization.
It is an interactive dashboard. Click here to interact with the dashboard on Power BI Service.
STEP 4: At this point, and with the help of the above visualizations, I was able to get the following insights and recommendations as listed below:
1. The general insight generated from the visualizations above shows that the company, KEYSTONE KITCHEN WARES LTD., has been spending money on things that has no capacity to boost the company's operation/revenue. While spending comparative lesser amount on things/categories which are the support system of any company's revenue.
2. A deep dive into the no.1 above, we examine the two most costly divisions (South and West) by expenses, and it clearly shows that these divisions respectively spends $73k and $44k on miscellaneous, while each division spends less than $35k on advert which is able to help make the company more visible to audience, thereby increasing the chances of patronage. From the figures of technical support and maintenance which ranks as the least categories where the company pushed money into, it's safe to say that customer's satisfaction were low seeing that a little was pushed into maintenance and technical support - as little as $6k in the South, and $5k in the West. The categories which are able to boost the company's revenue were not given attention.
3. A look into the two least expensive divisions (East and North) further validates the insight in no.2. East and North both had greater amounts going into advert than in miscellaneous when compared to South and West. They also had more money going into what I would call revenue generating categories in: maintenance, technical support, and software compared to what the South and West divisions spend in these categories.
4. Therefore, if a strict budget can be maintained, heavily cutting low the funds being expended on miscellaneous, and more money being channeled into advert, maintenance, technical support, and software, there soon would be an end to the financial quagmire of the company, Keystone Kitchenware LTD.
TOOLS USED:
1. Microsoft Excel: Data source
2. Power Query: For Data Exploration, Data Cleaning, and data Validation.
3. Power BI: For analysis and visualization.
RELATED PROJECT: TURNING MESSY DATA TO CLEAN DATA
Comments