20Feb
STATEMENT OF PROBLEM:
The Seller Supermarket is faced with a business/decision challenge of what categories of goods to get stocked with. They don't just want to purchase any category of goods, they want to know what exact categories of goods that would move fast in sales and generate huge income. They also want to know what categories of goods they should avoid, being that it slows down revenue generation. However, they also want to know what could be causing the slow low return in revenue, and in unit order, and recommendations on how it can be solved.
DATA COLLECTION:
I was given the stock and revenue dataset to work with
STEPS:
1. Asking of questions to understand the goal, and to understand the dataset.
2. Data Exploration, Cleaning and Validation:
Having received the dataset, I checked through the dataset to remove duplicates, nulls, and fixed wrong data types.
3. Loading from source into Power BI and sort out for metrics that would help in my analysis.
4. With the n0.1 - 4 all completed by 100%, I dived into proper analysis. Setting out key performance indicators.
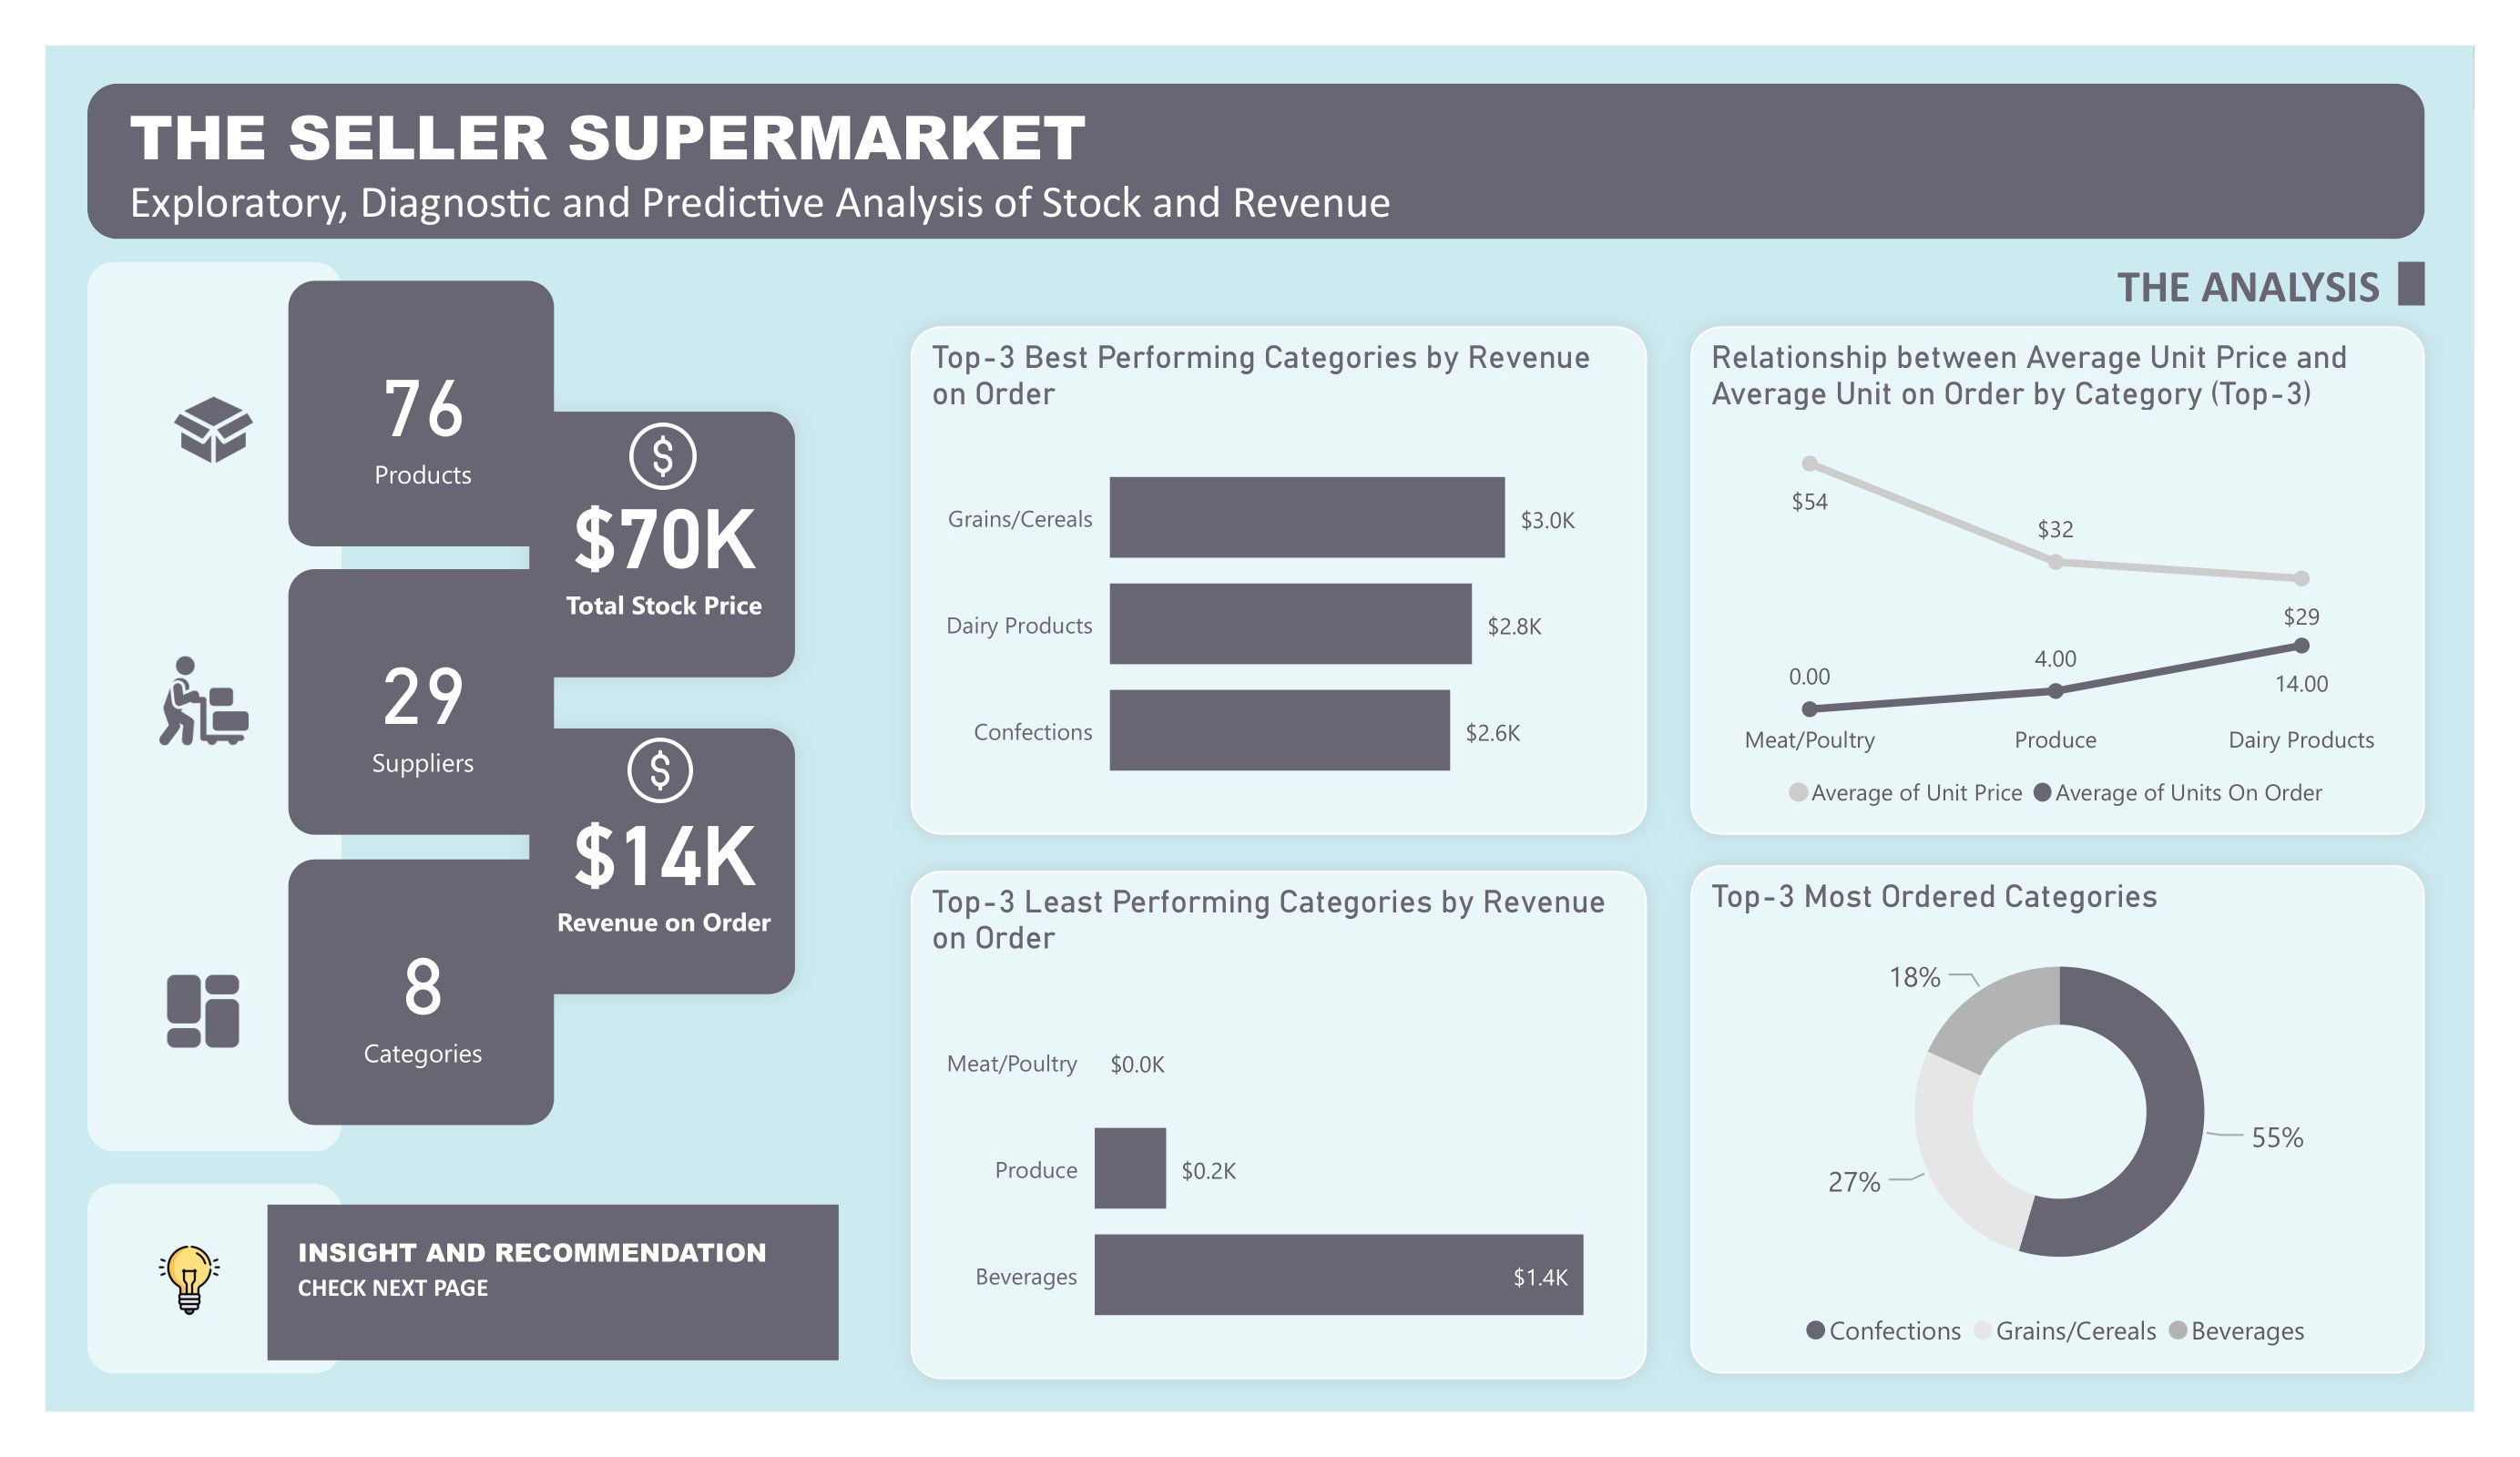
Below is the visualization of my analysis.
THE DASHBOARD
To interact with the dashboard on the Power BI Service, click here.
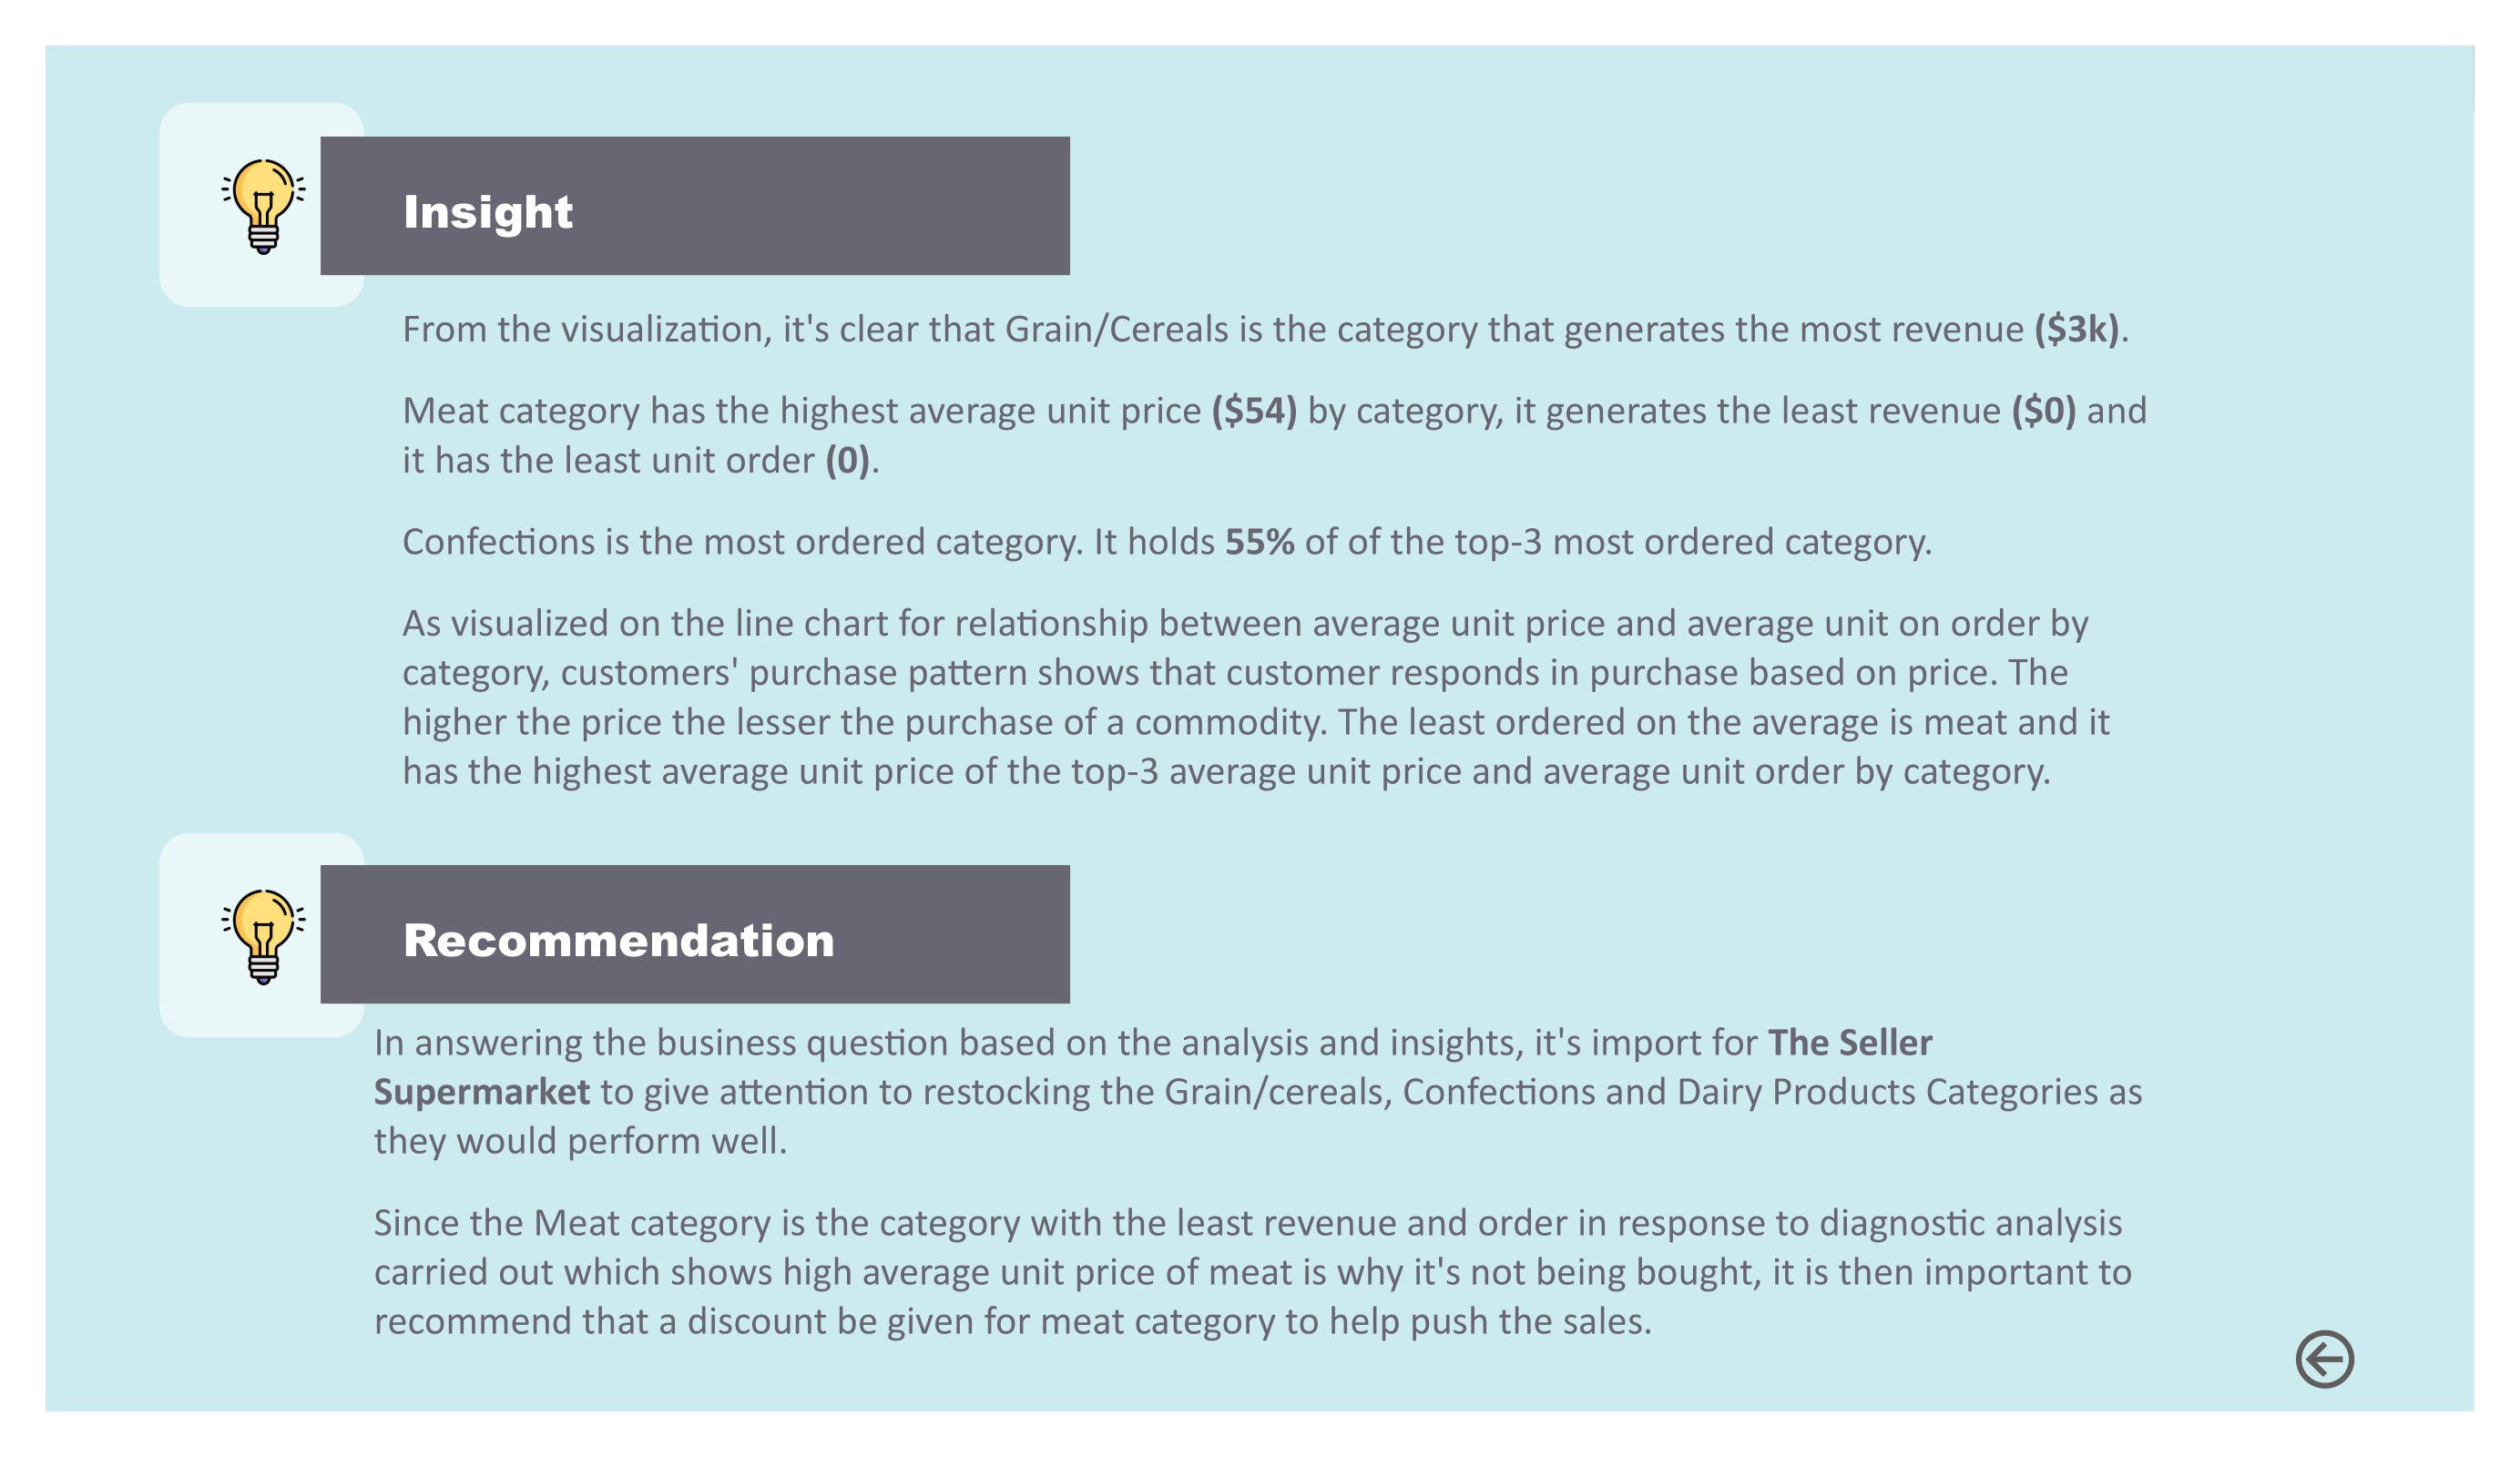
With proper analysis done, generating insights was just a matter of critical and analytical thinking.
INSIGHTS AND RECOMMENDATIONS
ALSO READ: Diagnostic Analysis for Keystone Kitchen-ware LTD. using Power BI
ALSO READ: MESSY DATA TO CLEAN DATA
Comments